

Monitoring & Reporting
Monitoring & Reporting is the read-only group in the admin console — it is about how to read Arbitex’s telemetry, not how to configure it. Unlike the other four Admin Guide groups, its pages walk you through reading, filtering, grouping, and exporting a view rather than changing a setting; the “API equivalent” on each page is the matching read/query endpoint, not a write.
What’s in this group
Section titled “What’s in this group”Each panel below maps 1:1 to a tab in the console’s Monitoring & Reporting group.
Audit logRead the tamper-evident, HMAC-chained record of logins, config changes, user management, and model invocations.
CostSpend rollup, forecast, cost by model, and per-scope caps.
DLP ActivityAggregate DLP detection trends cross-filtered with the drill-down event table.
Platform metricsRed/yellow/green service health for shared components, deployment units, and providers.
Model qualityScore trends, per-lens and per-model breakdowns, and fired quality alerts.
Usage & throttleActive throttles, usage-vs-limit quota, and consumption by provider and model.
BudgetSpend vs. limit, burn rate, and projection. The limit is authored in System.
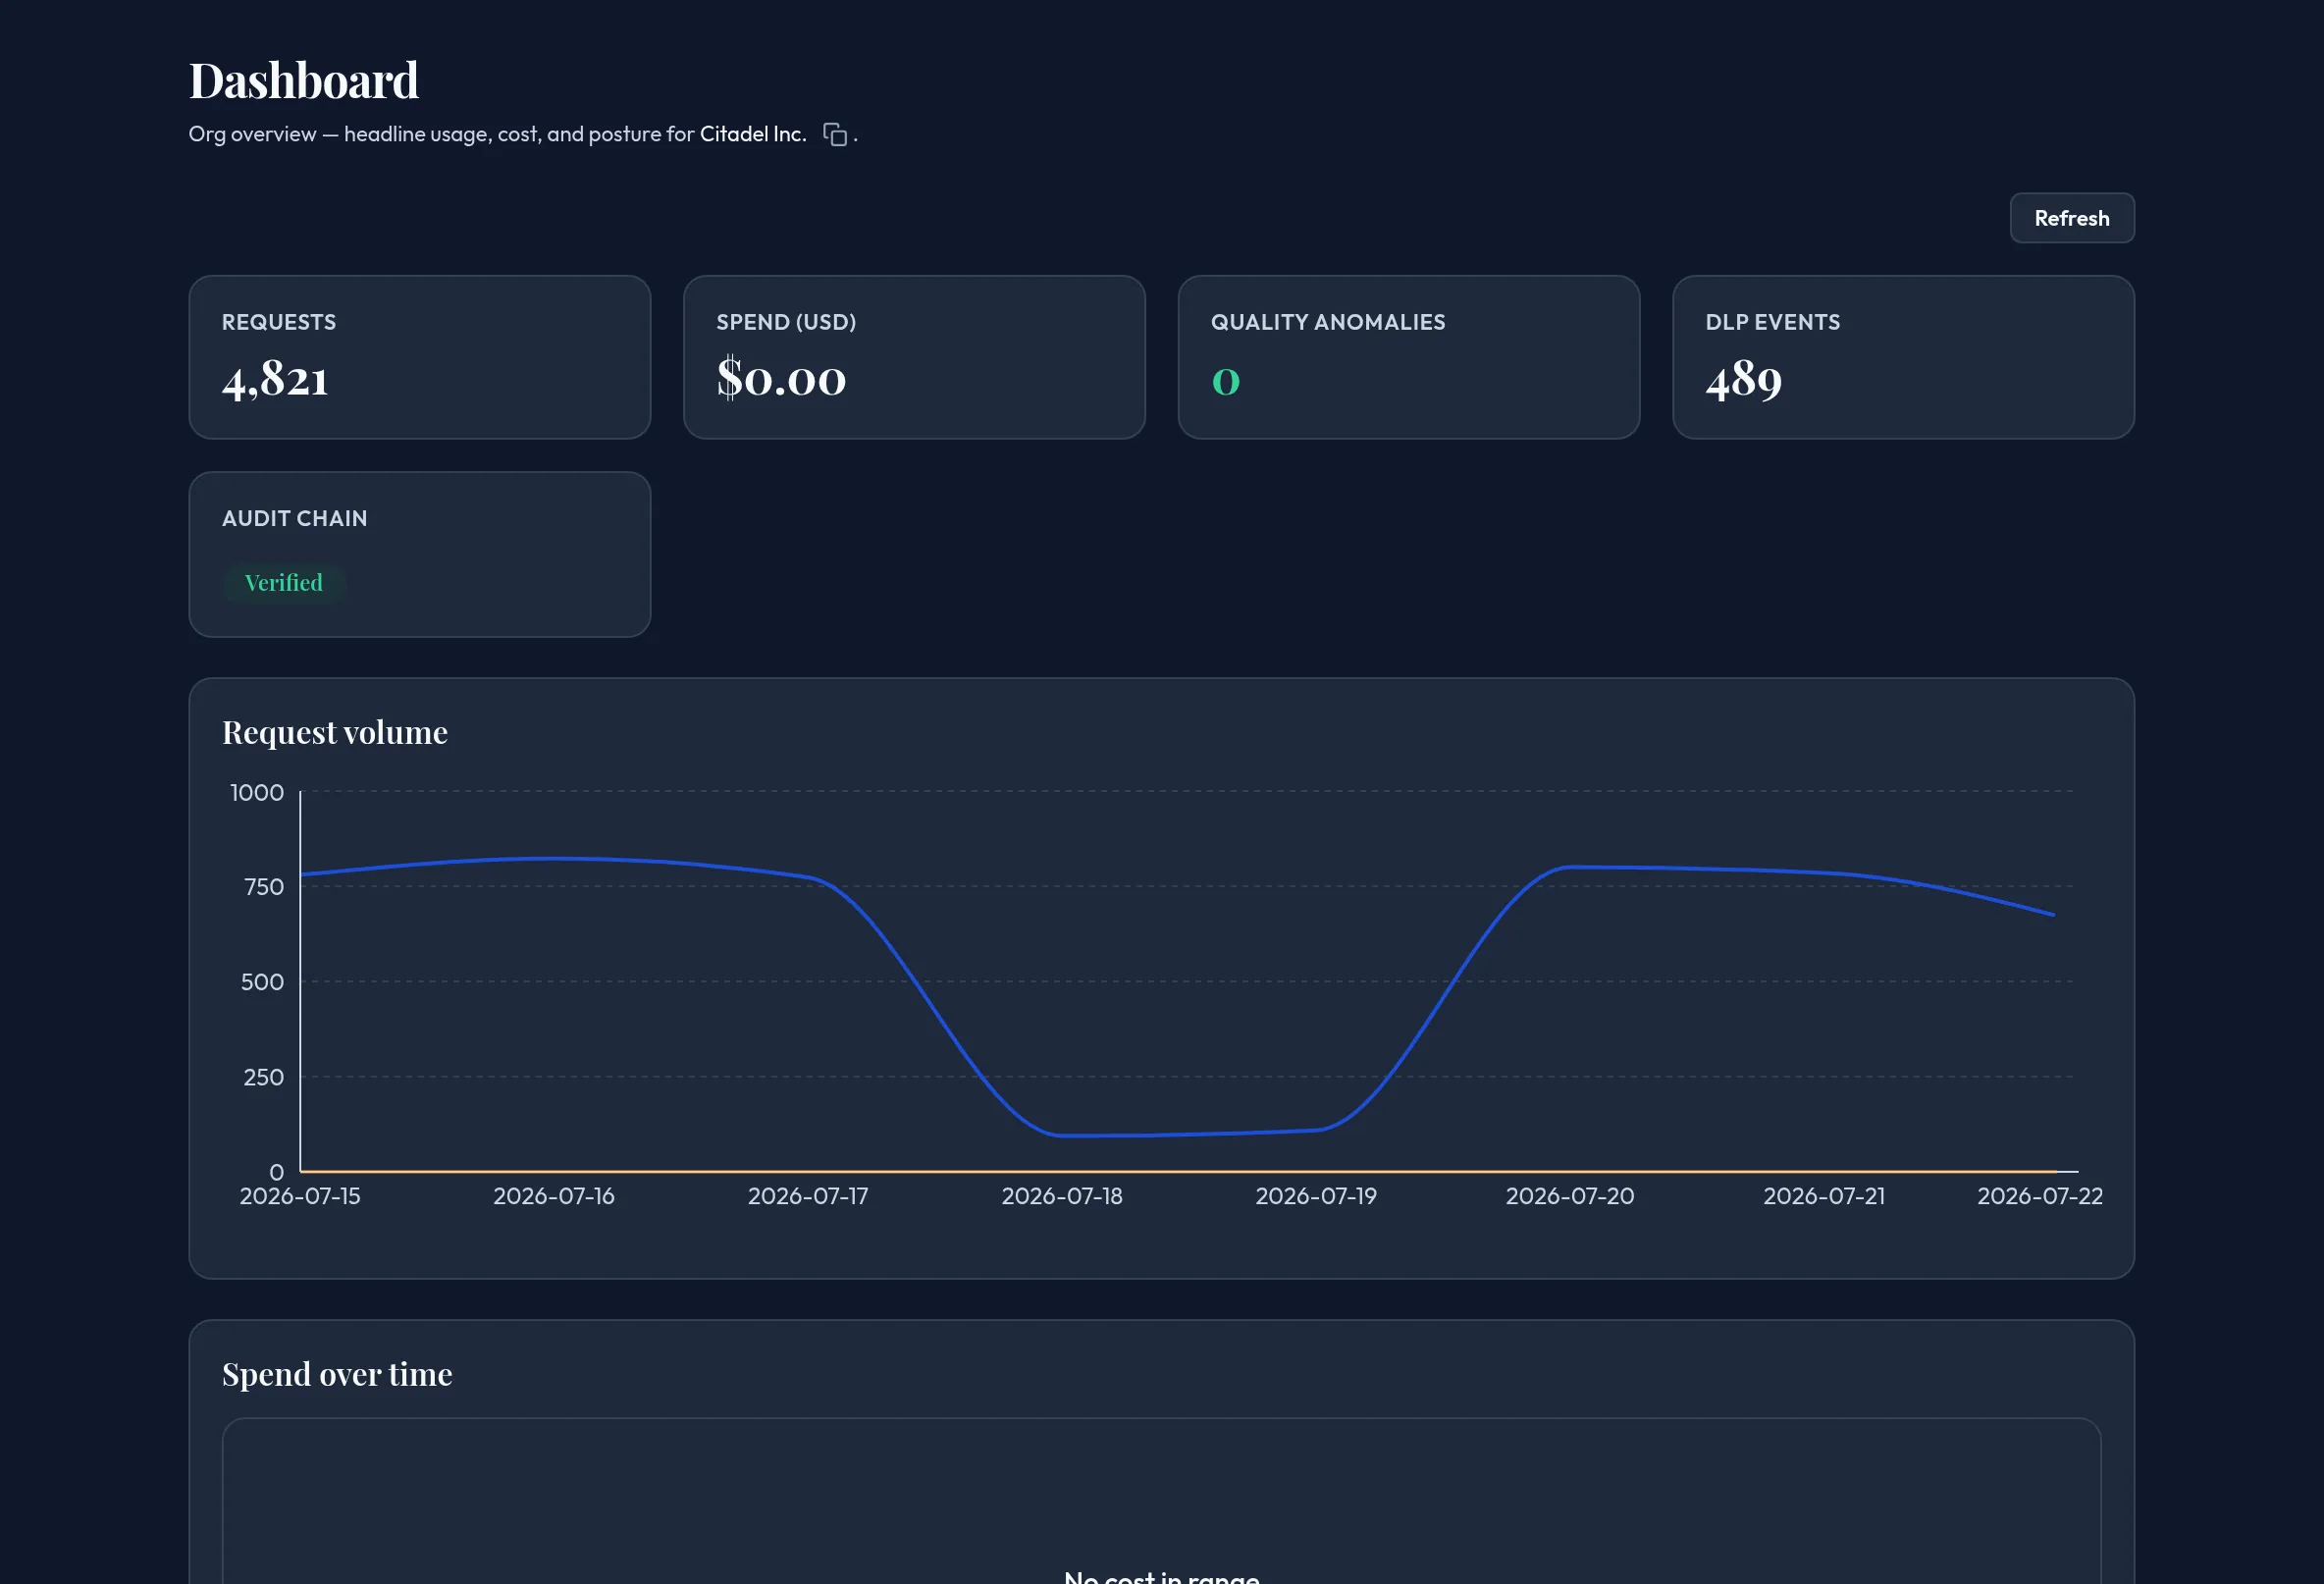
DashboardOrg overview — headline usage, cost, DLP, and audit posture.
Email StatsEmail quarantine volume, risk breakdown, and top detected entities.
Org HealthComposite posture across audit, DLP, quality, usage, and cost, plus outpost fleet liveness.
PerformanceOrg/service-level throughput, throttling, and model-latency observability.
AI InventoryThe sanctioned AI estate that flows through Arbitex — providers, models, MCP servers, and retrieval sources.
Compliance DashboardPosture summary, per-framework coverage, and control-mapping table with evidence-package export.
Compliance MatrixControl-by-framework coverage grid for your enabled compliance bundles.
Compliance ReportsGenerate and download on-demand per-framework evidence reports.