

Alerts
What it does
Section titled “What it does”Alerts authors alert rules: a metric, a comparison, a threshold, a time window, a cooldown, notification emails, and an enabled state. Each rule is a versioned config object, so it lives with the rest of the authoring surfaces in System even though its console route stays under Monitoring for deep-link stability. Below the rule list, Fire history shows recent threshold breaches read from the platform.
Configure in the UI
Section titled “Configure in the UI”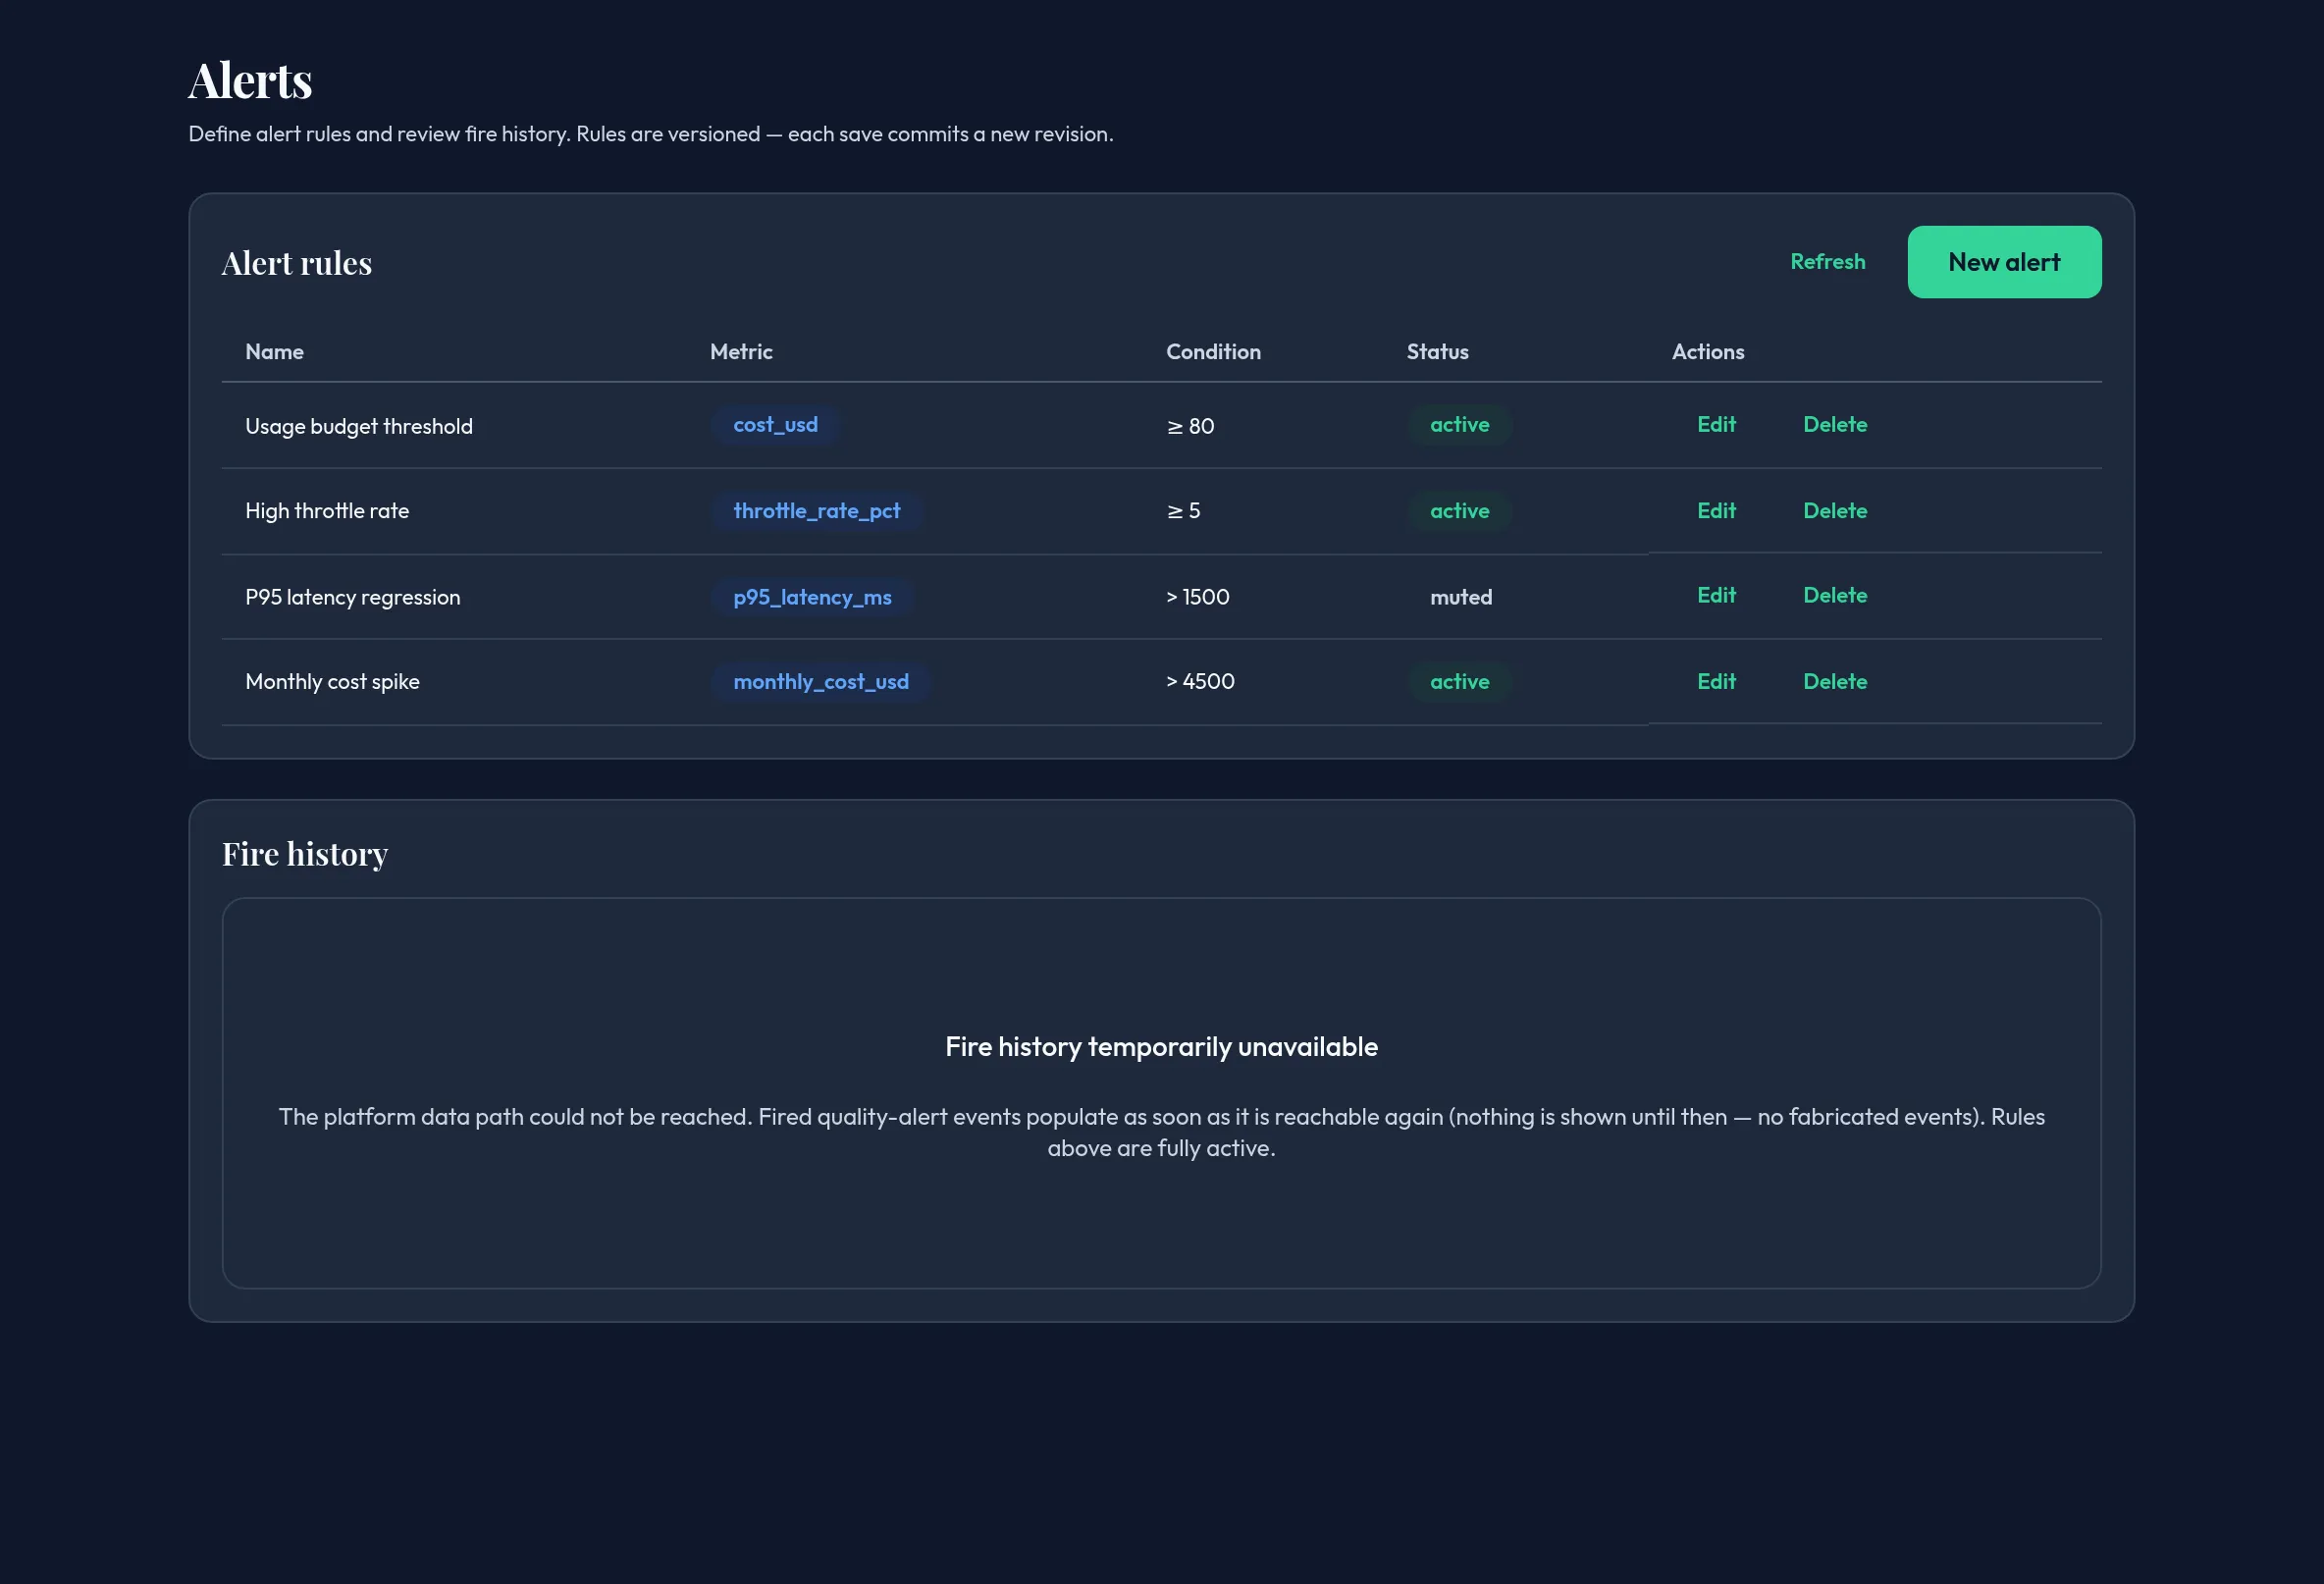
-
Open Alerts (console URL
/monitoring/alerts— the route was kept there for deep-link stability, though the surface is a System-style authoring page) and click New alert. -
Enter a Name, then choose a Metric from the fixed list: Cost (USD), Request count, Throttled count, Error rate, Latency p95 (ms), DLP events, or Quality anomaly score.
-
Choose a Comparison (greater than, less than, at least, at most, or equals) and a Threshold value.
-
Set the Window (minutes) the metric is evaluated over. A cooldown prevents the same rule from re-firing immediately after it fires.
-
Add one or more Notify emails as chips, toggle Enabled, then Save alert. Use Edit or Delete on any existing rule.
-
Review Fire history below for a timeline of past breaches — when each fired, its type, score, observed value versus threshold, and model.
API equivalent
Section titled “API equivalent”List rules, author a rule, and read fire history:
curl -X POST "https://admin.arbitex.ai/api/v1/admin/monitoring/alerts/list" \  -H "Authorization: Bearer $ADMIN_TOKEN"
curl -X POST "https://admin.arbitex.ai/api/v1/admin/monitoring/alerts/set" \  -H "Authorization: Bearer $ADMIN_TOKEN" \  -H "Content-Type: application/json" \  -d '{"name": "High DLP volume", "metric": "dlp_events", "comparison": "gt", "threshold": 100, "window_minutes": 60, "cooldown_minutes": 60, "enabled": true, "notify_emails": ["[email protected]"]}'# → { "rule": { "id": "...", "name": "High DLP volume", ... }, "revision": 7 }
curl -X POST "https://admin.arbitex.ai/api/v1/admin/monitoring/alerts/delete" \  -H "Authorization: Bearer $ADMIN_TOKEN" \  -H "Content-Type: application/json" \  -d '{"id": "$RULE_ID"}'
curl -X POST "https://admin.arbitex.ai/api/v1/admin/monitoring/alerts/history" \  -H "Authorization: Bearer $ADMIN_TOKEN"
Plan & availability
Section titled “Plan & availability”Alert rule authoring is available on every plan. The number of active rules is not gated by plan tier today.
Deployment notes
Section titled “Deployment notes”On a Hybrid Outpost, alert rules evaluate against that deployment’s own telemetry, so a rule authored there only fires on that Outpost’s traffic. In an air-gapped deployment, rule evaluation and fire history both work against locally collected telemetry, with no external dependency; email notification delivery depends on your local mail relay being reachable.
Related
Section titled “Related”- Budget — a related, but separate, spend-visibility surface (not an alert rule).
- Monitoring overview — where usage, cost, and DLP telemetry that feeds these metrics is reviewed in depth.