

Usage & throttle
What it does
Section titled “What it does”Usage & throttle is a fully read-only usage-and-consumption dashboard: an Active throttles panel (what’s being rate-limited right now), usage-vs-limit quota (requests/tokens/cost against the authored per-subject quotas), a requests/throttled trend, requests by provider, token consumption by model, and a regroupable usage-breakdown table (by model or provider). Per-account usage-alert thresholds are authored on the Alerts surface in System, not here.
Configure in the UI
Section titled “Configure in the UI”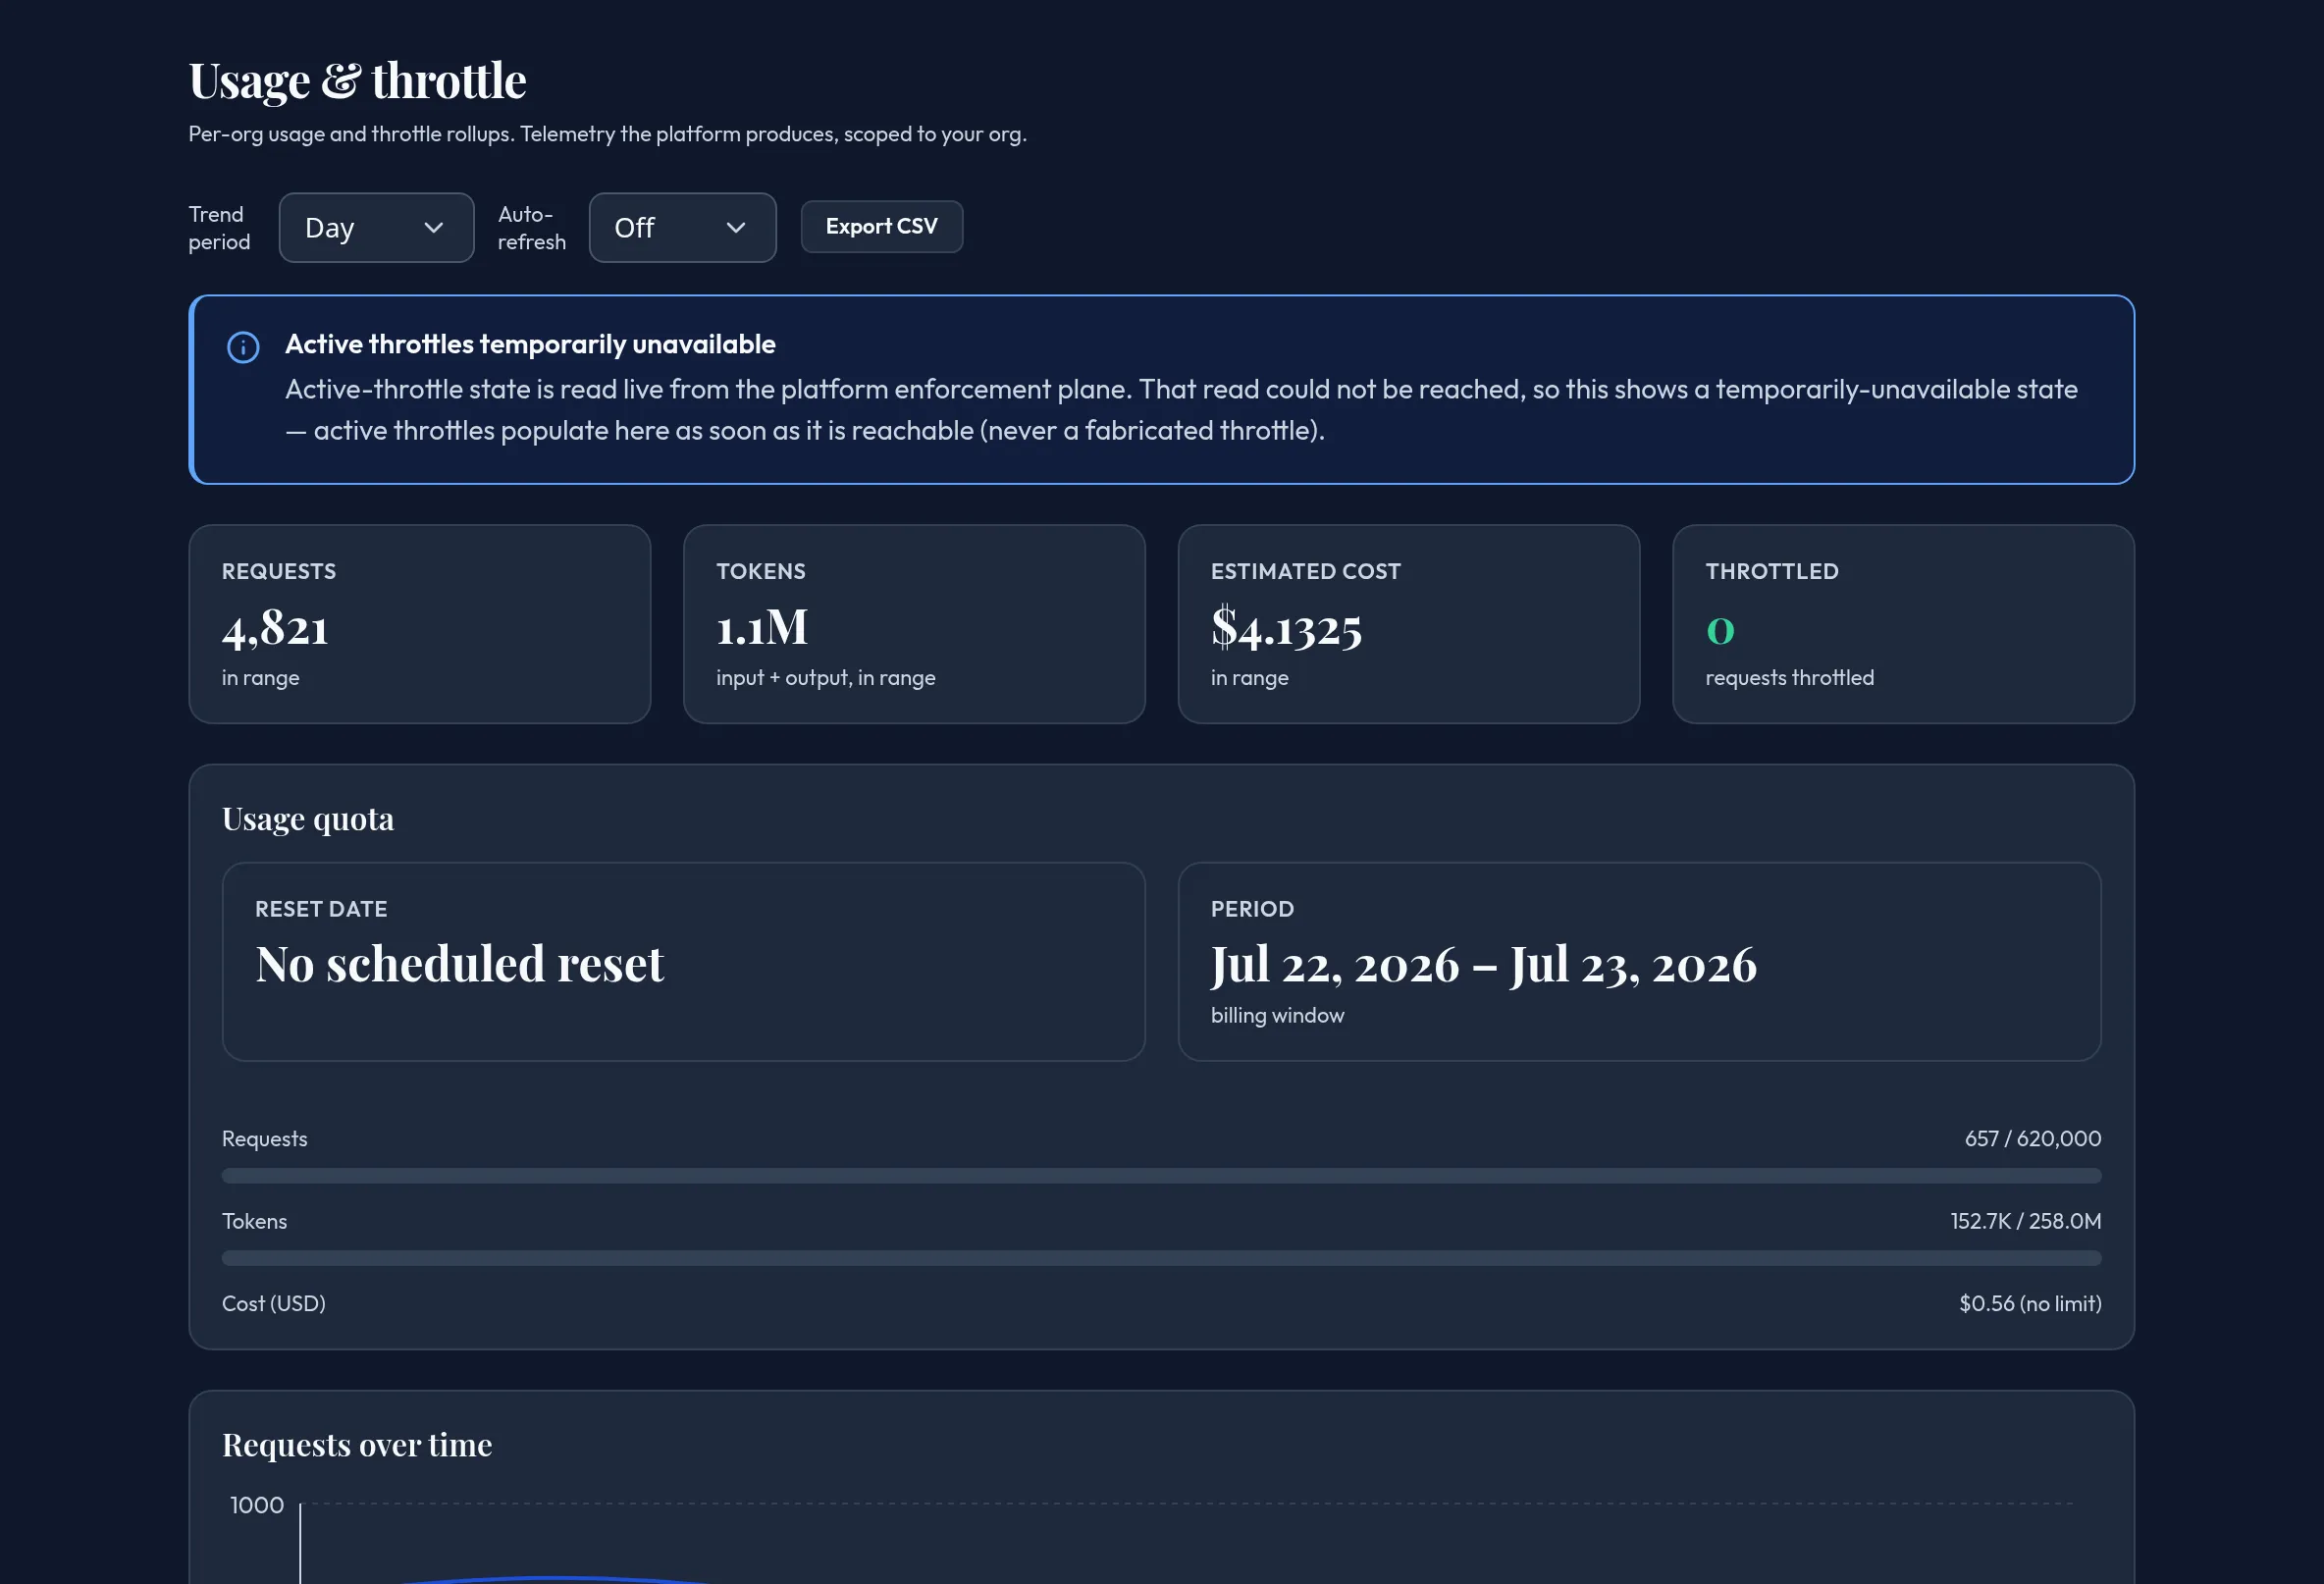
-
Open Monitoring & Reporting → Usage & throttle. Active throttles leads the page — a calm “no active throttles” state, an honest “temporarily unavailable” note if the platform enforcement-plane read can’t be reached, or an urgent panel naming every throttled subject, its trigger (for example “@110%”), the action taken, effective-until, and the breached limit.
-
Review the summary tiles (Requests, Tokens, Estimated cost, Throttled) and the Usage quota card (reset date, billing period, and used/limit meters for requests, tokens, and cost — a missing limit reads “(no limit),” never a fabricated denominator).
-
Pick a Trend period for the requests-over-time chart.
-
Review Requests by provider and Token consumption by model.
-
Use the usage-breakdown table’s Group by control to regroup by model or provider (requests, tokens, and estimated cost per group).
-
Scroll to the retained Recent usage rollups table for the raw per-window figures.
API equivalent
Section titled “API equivalent”curl -X POST "https://admin.arbitex.ai/api/v1/admin/monitoring/usage/quota" \ -H "Authorization: Bearer $ADMIN_TOKEN" \ -H "Content-Type: application/json" \ -d '{}'Trend and breakdown charts read usage/timeseries and usage/breakdown;
active enforcement reads usage/active-throttles; the raw rollup table reads
usage/list.
Plan & availability
Section titled “Plan & availability”Available on every plan. Quota limits, if any, are configured per subject elsewhere in the admin console — this page only shows usage against them.
Deployment notes
Section titled “Deployment notes”Active-throttle state is a platform enforcement-plane read; in air-gapped deployments without a path to the platform, it shows “temporarily unavailable” rather than an assumed-clear state.