

Model quality
What it does
Section titled “What it does”Model quality is analytics and LLMOps-style observability for your org’s traffic: drift, anomaly, and fairness-style quality lenses over time. It shows an average-score tile, anomaly and evaluation-volume counts, a quality trend (score and anomalies over time), average score by lens, evaluation volume by model, fired quality-alert history, and the real per-score alert firing thresholds.
Configure in the UI
Section titled “Configure in the UI”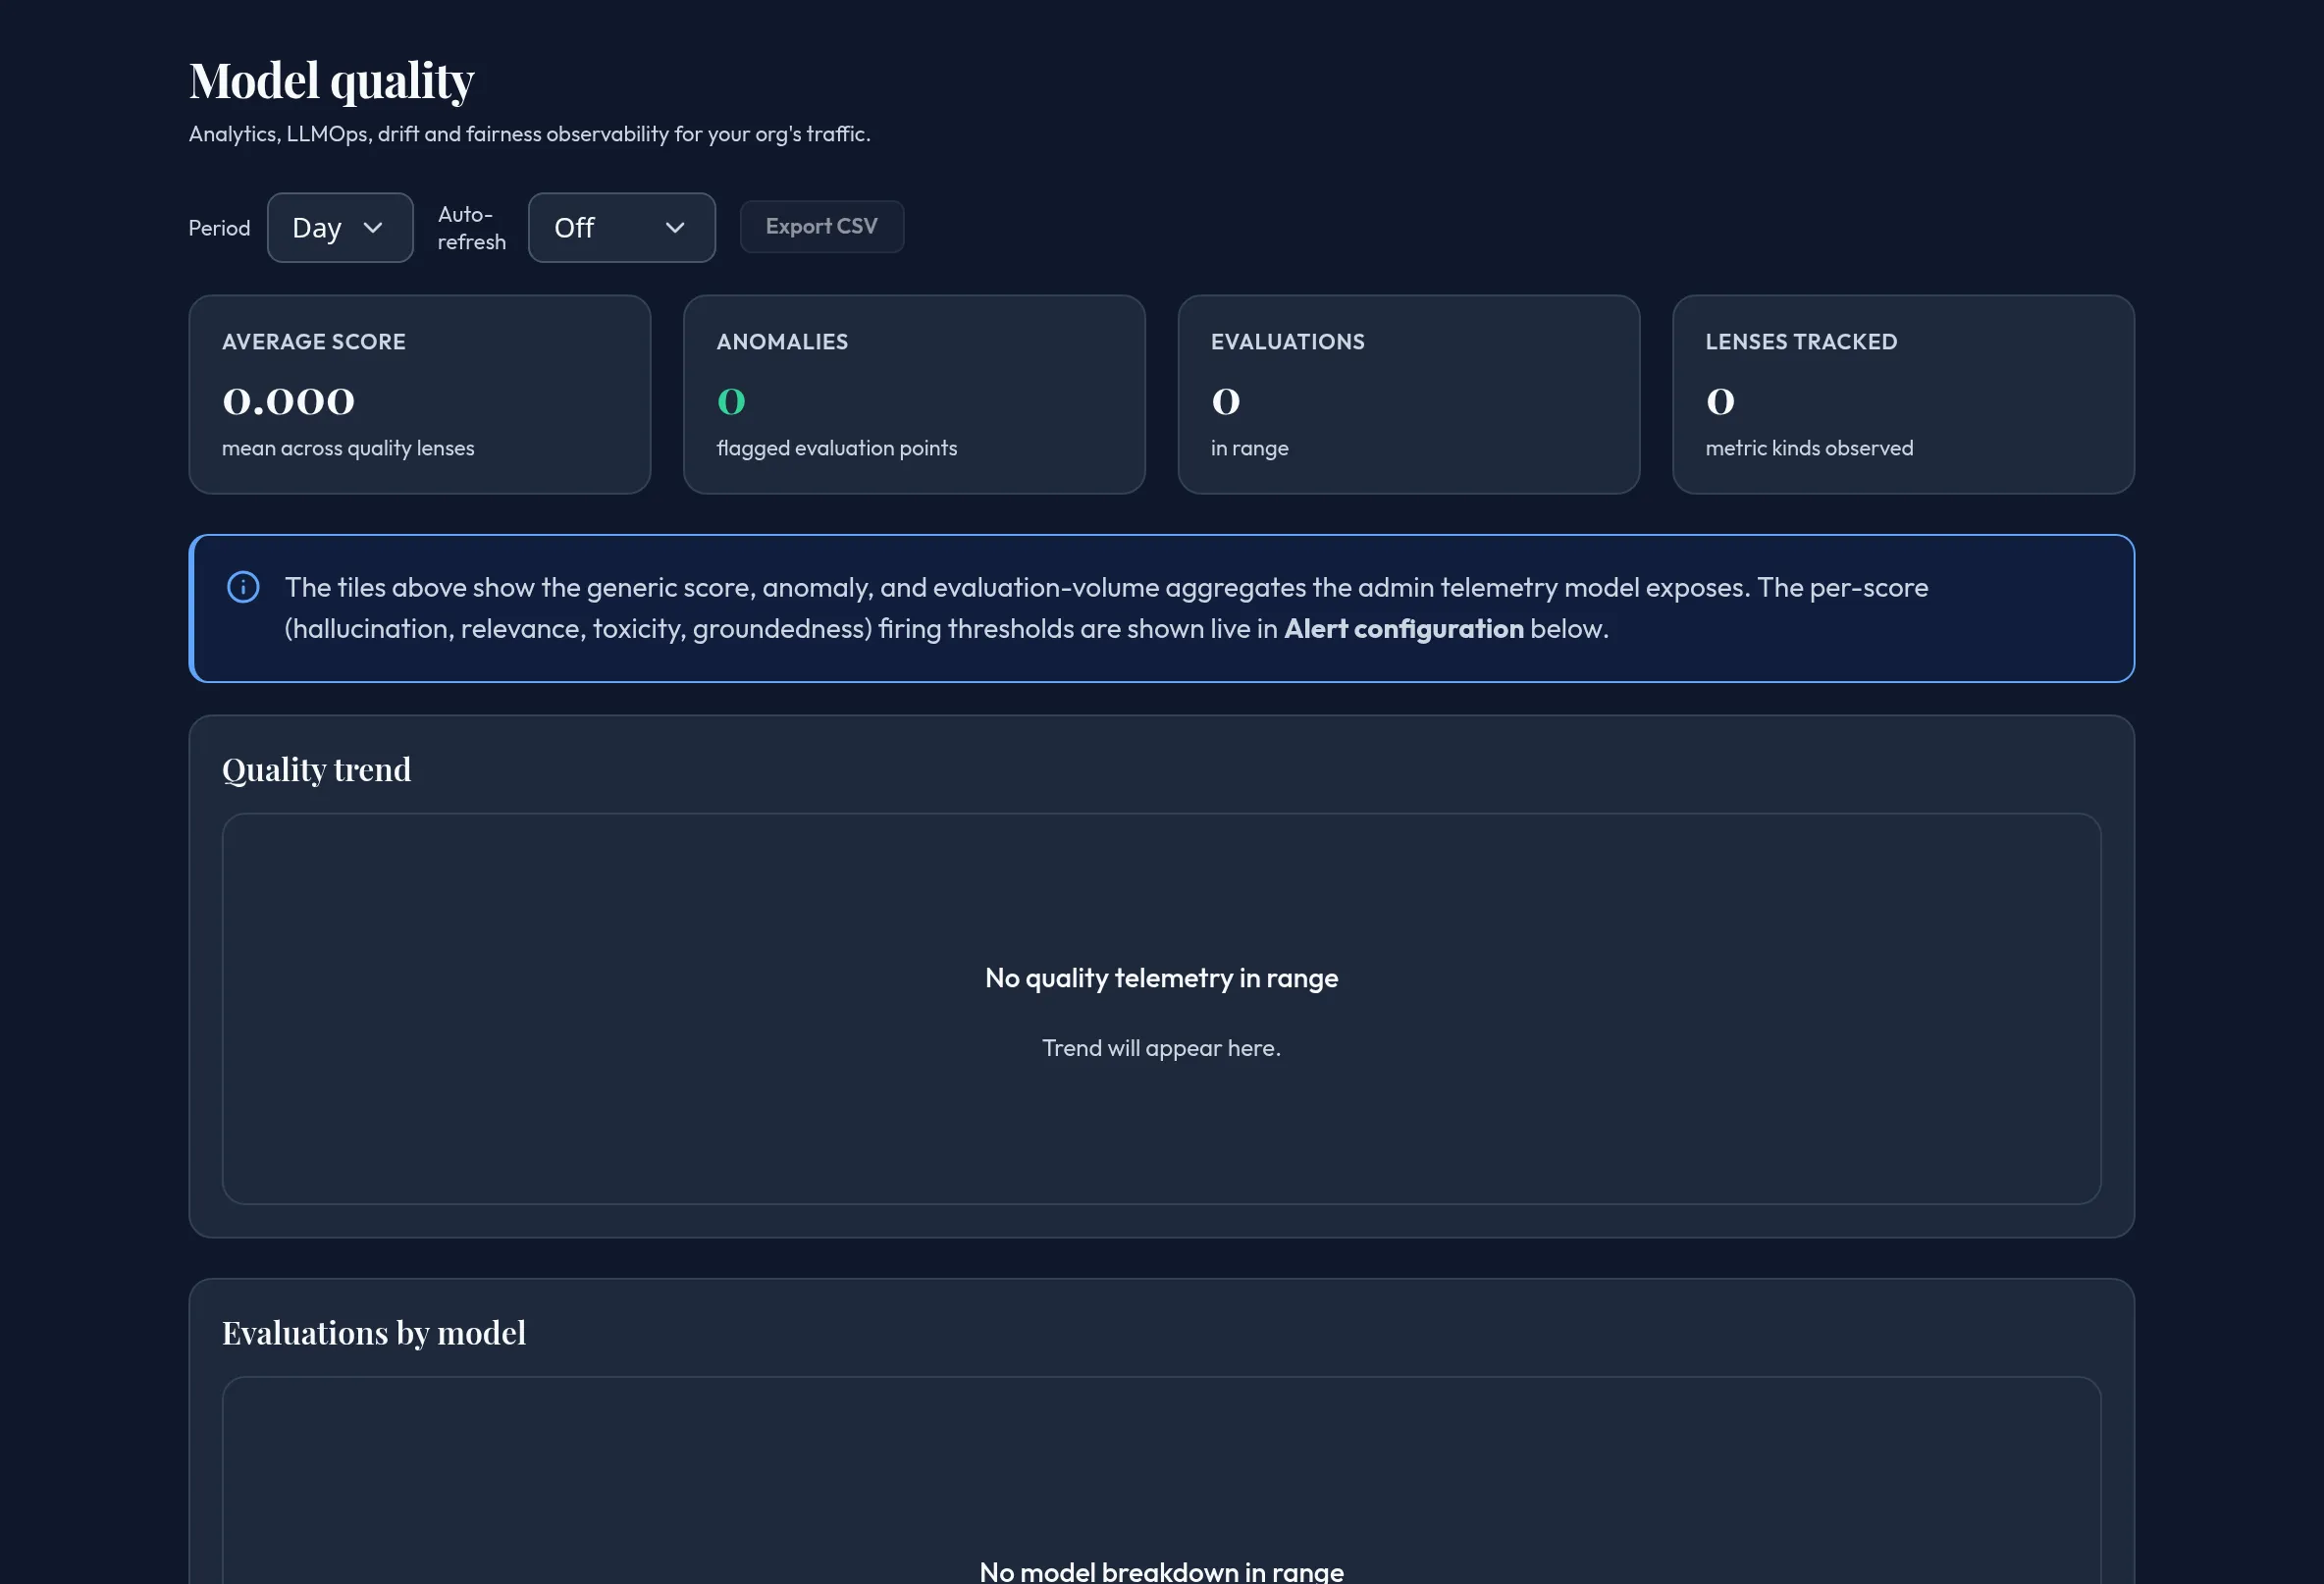
-
Open Monitoring & Reporting → Model quality. Pick a Period (Day / Week / Month) for the trend chart’s granularity.
-
Review the summary tiles — Average score, Anomalies, Evaluations, Lenses tracked. Only the generic score/anomaly/volume aggregates show here; the four named per-score thresholds (for example hallucination, relevance, toxicity, groundedness) appear live in Alert configuration below.
-
Review Average score by lens and Evaluations by model.
-
Review Quality alert history (real fired alerts: score, threshold, observed value, model, fired-at) and Alert configuration (the real per-score firing thresholds). Both read “Temporarily unavailable” if the platform read can’t be reached — never a fabricated event or threshold.
-
Scroll to the retained Recent quality events table (lens, metric, model, value, window, anomalous flag).
-
Export report (PDF/CSV) is a disclosed-pending affordance — the buttons are visible but disabled; there’s no backing export endpoint yet.
API equivalent
Section titled “API equivalent”curl -X POST "https://admin.arbitex.ai/api/v1/admin/monitoring/quality/timeseries" \ -H "Authorization: Bearer $ADMIN_TOKEN" \ -H "Content-Type: application/json" \ -d '{"bucket": "day", "series": ["score", "anomalies", "points"]}'The lens and model breakdowns read quality/breakdown; the raw drill-down
table reads quality/list.
Plan & availability
Section titled “Plan & availability”Available on every plan.
Deployment notes
Section titled “Deployment notes”Alert history and alert configuration are cross-plane platform reads; in air-gapped deployments without a path to the platform, they show “temporarily unavailable” rather than being hidden.