

Performance
What it does
Section titled “What it does”Performance reports org/service-level throughput, throttling, and quality-lens latency for your traffic — distinct from pod-level infrastructure metrics, which are an operator concern and aren’t shown here. It includes a summary status bar, throughput/throttling and latency trend charts, a per-model latency table, and — where the platform read is reachable — real per-model p50/p95/p99 request-latency percentiles.
Configure in the UI
Section titled “Configure in the UI”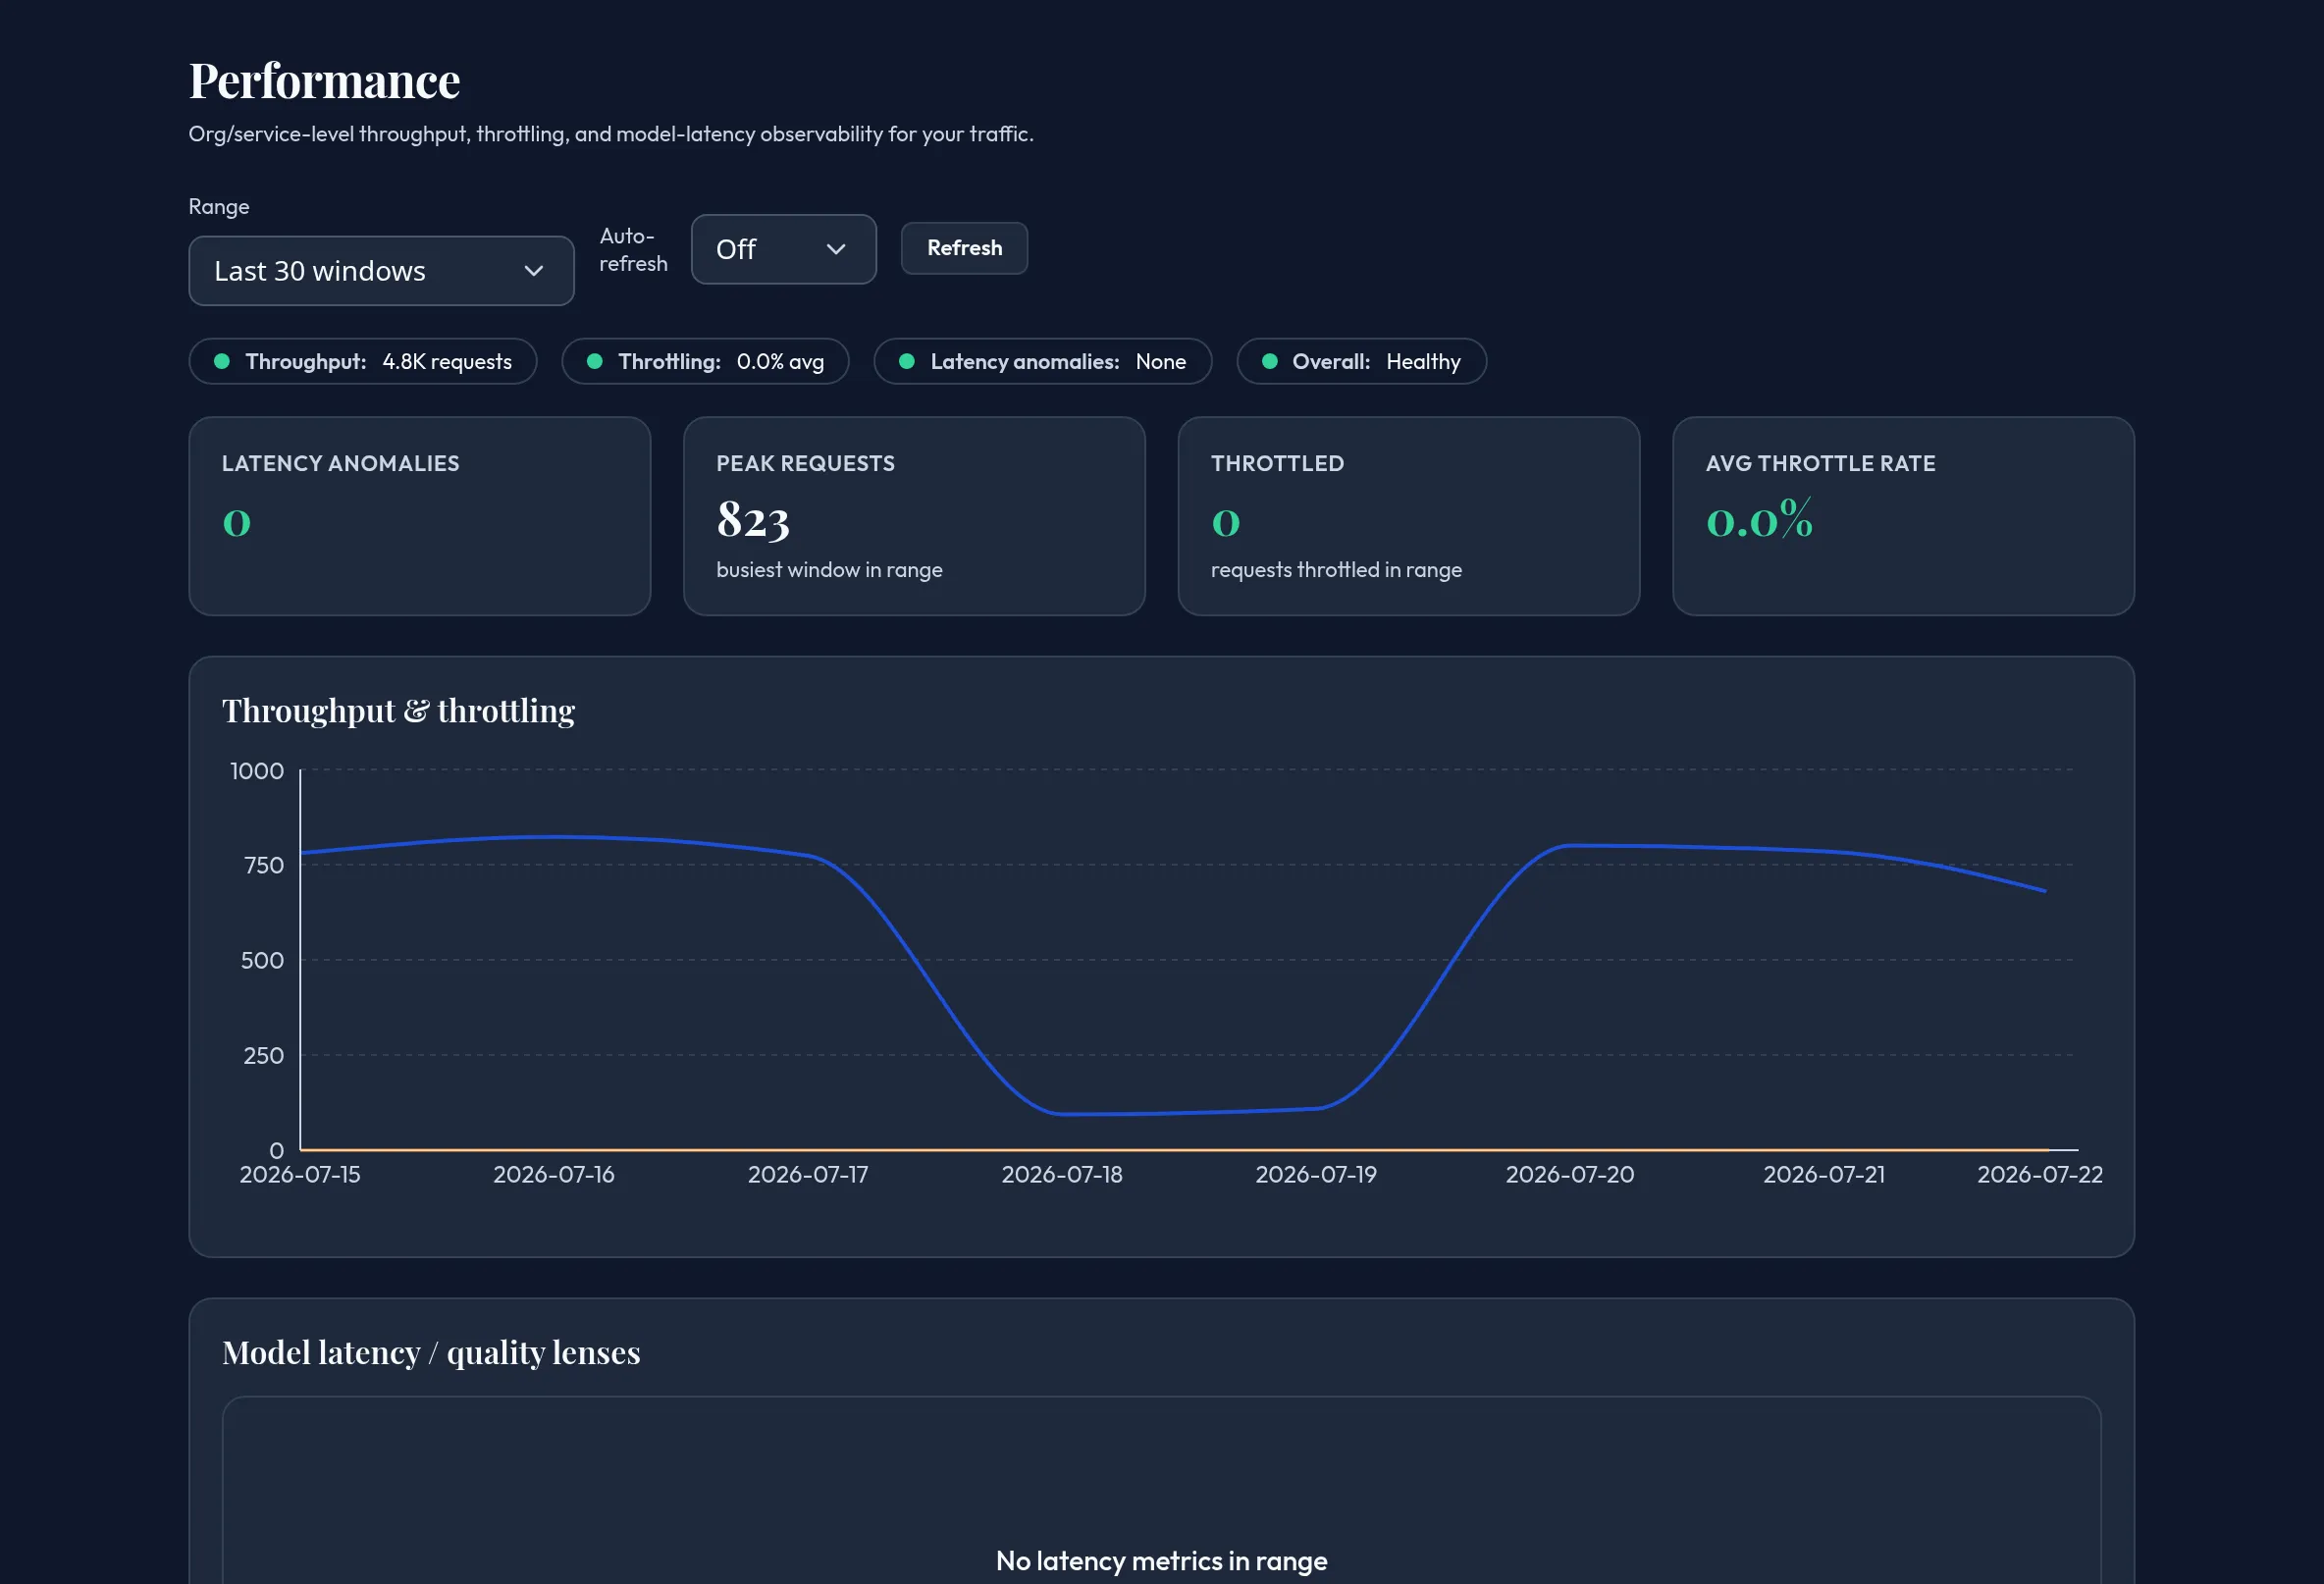
-
Open Monitoring & Reporting → Performance. Pick a Range for the charts and an Auto-refresh cadence, or click Refresh.
-
Review the summary status bar (Throughput, Throttling, Latency anomalies, Overall) and the KPI tiles (Latency anomalies, Peak requests, Throttled, Avg throttle rate).
-
Review Throughput & throttling and Model latency / quality lenses trend charts, with anomaly badges on flagged metrics.
-
Review Latency by model — the latest value, sample count, and anomalous flag per model/metric pair.
-
Review Latency percentiles — real p50/p95/p99/avg/request-count per model, sourced from a platform read. It shows “Temporarily unavailable” if that read can’t be reached.
API equivalent
Section titled “API equivalent”curl -X POST "https://admin.arbitex.ai/api/v1/admin/monitoring/performance/summary" \ -H "Authorization: Bearer $ADMIN_TOKEN" \ -H "Content-Type: application/json" \ -d '{}'Latency percentiles read performance/percentiles.
Plan & availability
Section titled “Plan & availability”Available on every plan.
Deployment notes
Section titled “Deployment notes”Latency percentiles are a platform cross-plane read; air-gapped deployments without a platform path show “temporarily unavailable,” never fabricated latencies.