

Dashboard
What it does
Section titled “What it does”Dashboard is the org-overview landing surface for Monitoring & Reporting: a KPI strip (requests, spend, quality anomalies, DLP events, audit-chain status), request-volume and spend trend charts, budget-utilization and model-risk widgets, DLP posture, recent audit activity, org-health indicators, and — where the platform backs them — webhook-delivery, GeoIP-traffic, and usage-quota widgets.
Configure in the UI
Section titled “Configure in the UI”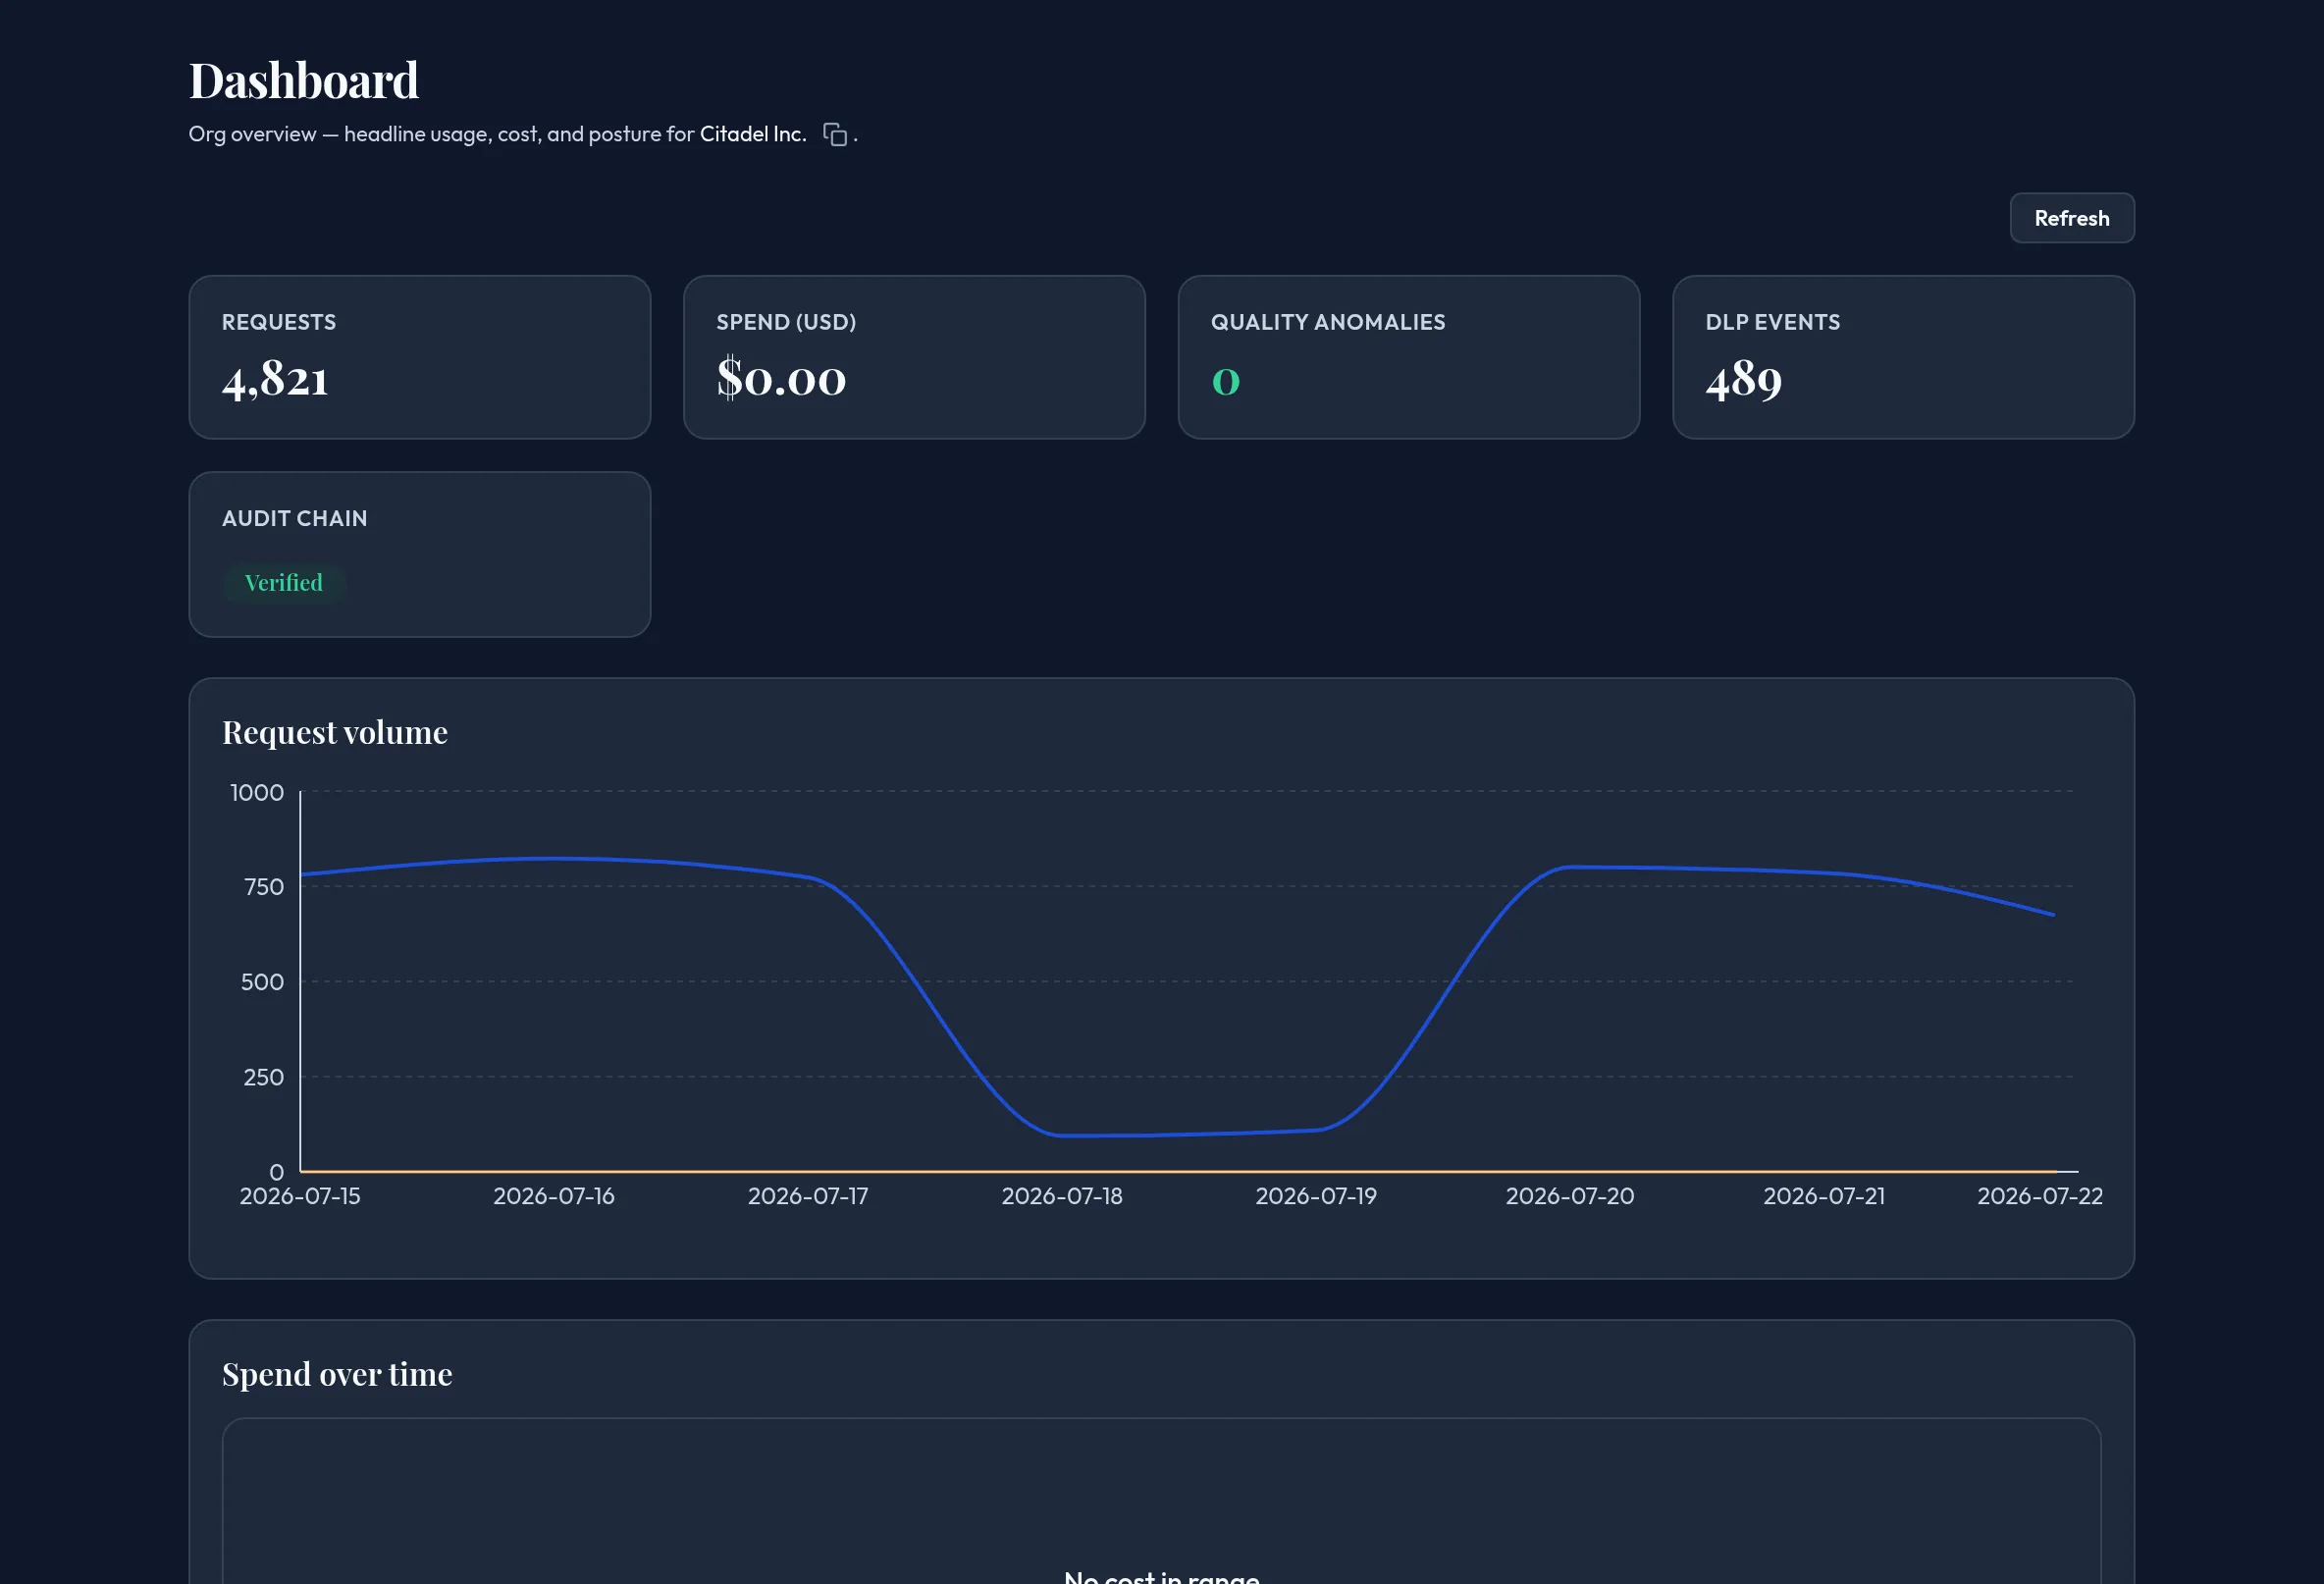
-
Open Monitoring & Reporting → Dashboard. The KPI strip shows requests, spend, quality anomalies, DLP events, and whether the audit chain verified.
-
Review Request volume and Spend over time trend charts.
-
Review Budget utilization (spend vs. the configured limit) and Model risk (anomalies by model).
-
Review the DLP posture, Recent activity (the last 5 audit entries plus the chain-valid badge), and Org health panels.
-
Review Webhook deliveries, Usage quota, and GeoIP traffic by country. An empty ledger or an unconfigured quota is shown honestly, not hidden; any panel the platform can’t currently serve shows an explicit “pending backend” or “temporarily unavailable” state instead.
-
Click Refresh to reload every panel.
API equivalent
Section titled “API equivalent”curl -X POST "https://admin.arbitex.ai/api/v1/admin/monitoring/dashboard/summary" \ -H "Authorization: Bearer $ADMIN_TOKEN" \ -H "Content-Type: application/json" \ -d '{}'The widget panels read dashboard/widgets; the cross-surface panels compose
dlp/stats, org-health/summary, audit/list, usage/quota, and
dashboard/traffic-geo.
Plan & availability
Section titled “Plan & availability”Available on every plan.
Deployment notes
Section titled “Deployment notes”Each panel fetches independently, so one failing read never blanks the whole dashboard. In air-gapped deployments, cross-plane widgets (GeoIP, platform-backed webhook deliveries) degrade honestly rather than fabricating data.