

Org Health
What it does
Section titled “What it does”Org Health is a composite, read-only health dashboard: an overall roll-up plus per-subsystem status (audit, DLP, quality, usage, cost) with KPI tiles, and an outpost fleet-liveness section — a status summary plus a per-outpost table (name, region, health, last seen, cert-expiry, uptime).
Configure in the UI
Section titled “Configure in the UI”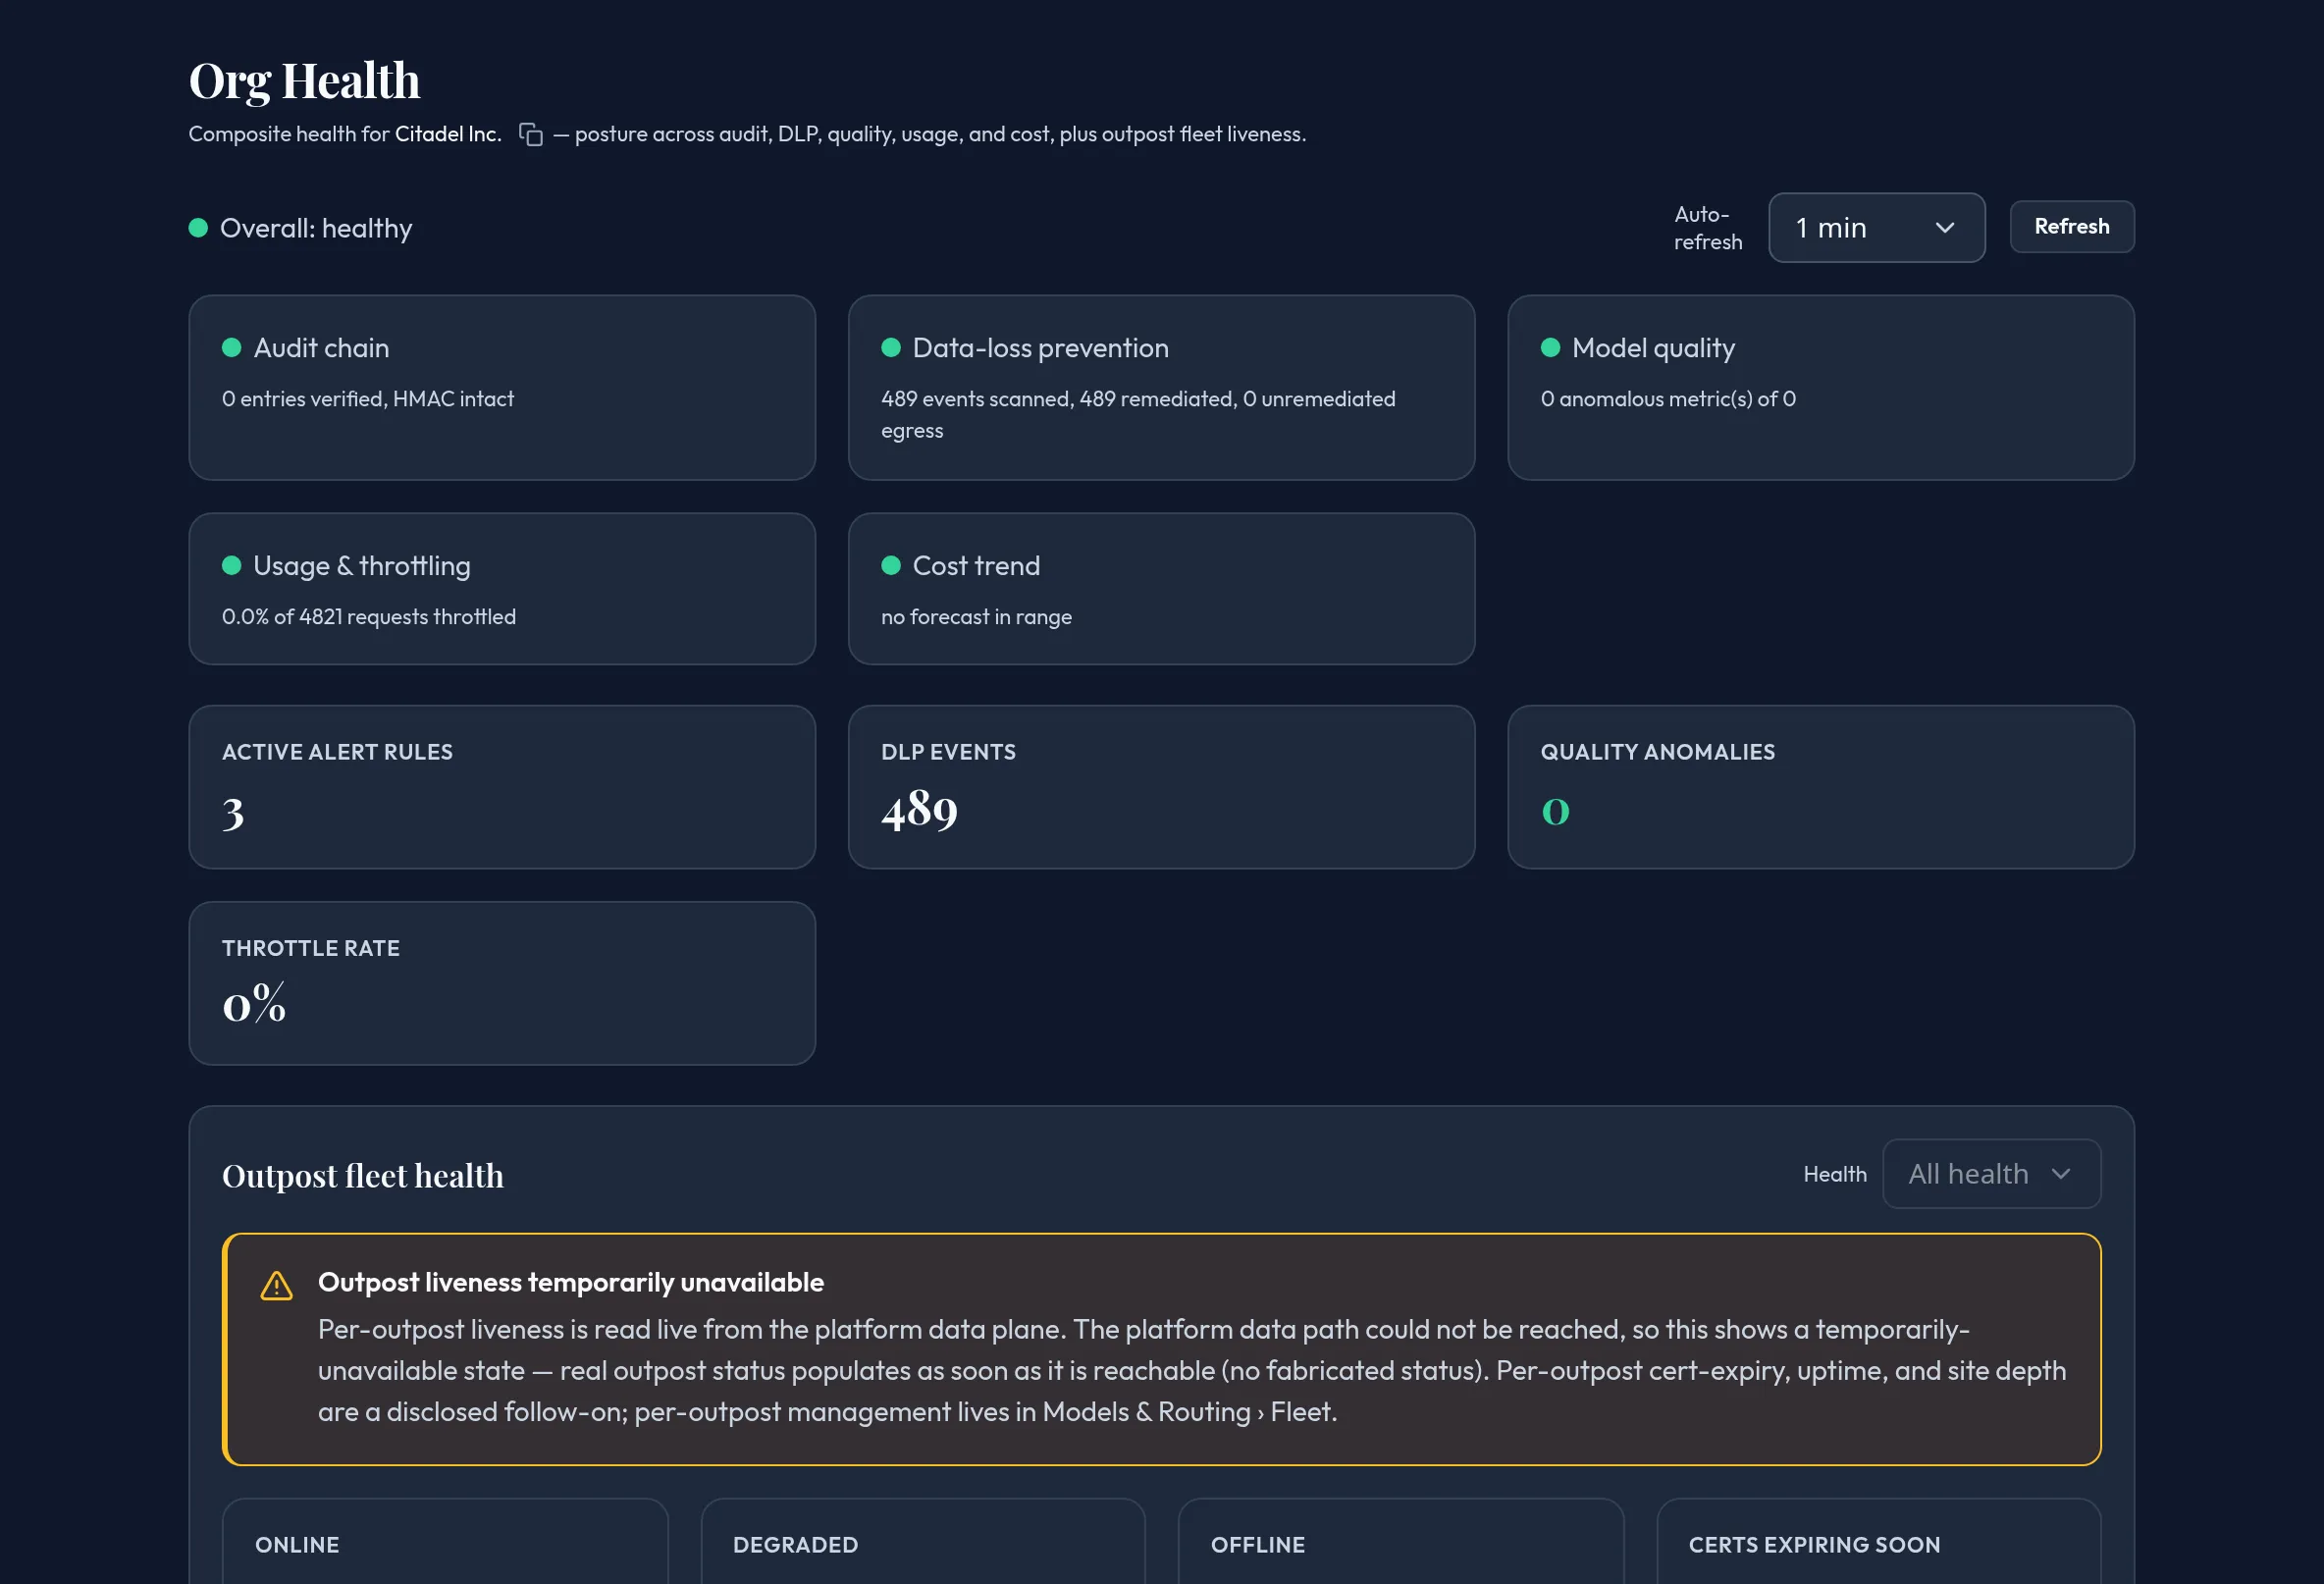
-
Open Monitoring & Reporting → Org Health. Review the Overall status pill and the per-subsystem status cards.
-
Review the key-metric tiles: Active alert rules, DLP events, Quality anomalies, Throttle rate.
-
Set an Auto-refresh cadence, or click Refresh.
-
Review Outpost fleet health — Online / Degraded / Offline / Certs expiring soon counts and the per-outpost table. Filter the table by Health status.
-
If per-outpost liveness can’t be read from the platform, the section shows an explicit “temporarily unavailable” notice instead of an empty or fabricated fleet. Per-outpost cert-expiry, uptime, and site depth are a disclosed follow-on; day-to-day outpost management lives in Models & Routing → Fleet, not here.
API equivalent
Section titled “API equivalent”curl -X POST "https://admin.arbitex.ai/api/v1/admin/monitoring/org-health/summary" \ -H "Authorization: Bearer $ADMIN_TOKEN" \ -H "Content-Type: application/json" \ -d '{}'Outpost fleet liveness reads org-health/fleet.
Plan & availability
Section titled “Plan & availability”Available on every plan.
Deployment notes
Section titled “Deployment notes”Outpost liveness is a platform cross-plane read; in air-gapped deployments it shows “temporarily unavailable” honestly rather than a fabricated status. Fleet management (adding or removing outposts) happens in Models & Routing → Fleet, not here.