

Email Stats
What it does
Section titled “What it does”Email Stats reports email-channel DLP-scanning activity for your org: total quarantined messages, a high/medium/low risk breakdown, trailing-24h scan volume, average scan latency, a quarantine-volume trend, a quarantine-by-action breakdown, and top detected entity types.
Configure in the UI
Section titled “Configure in the UI”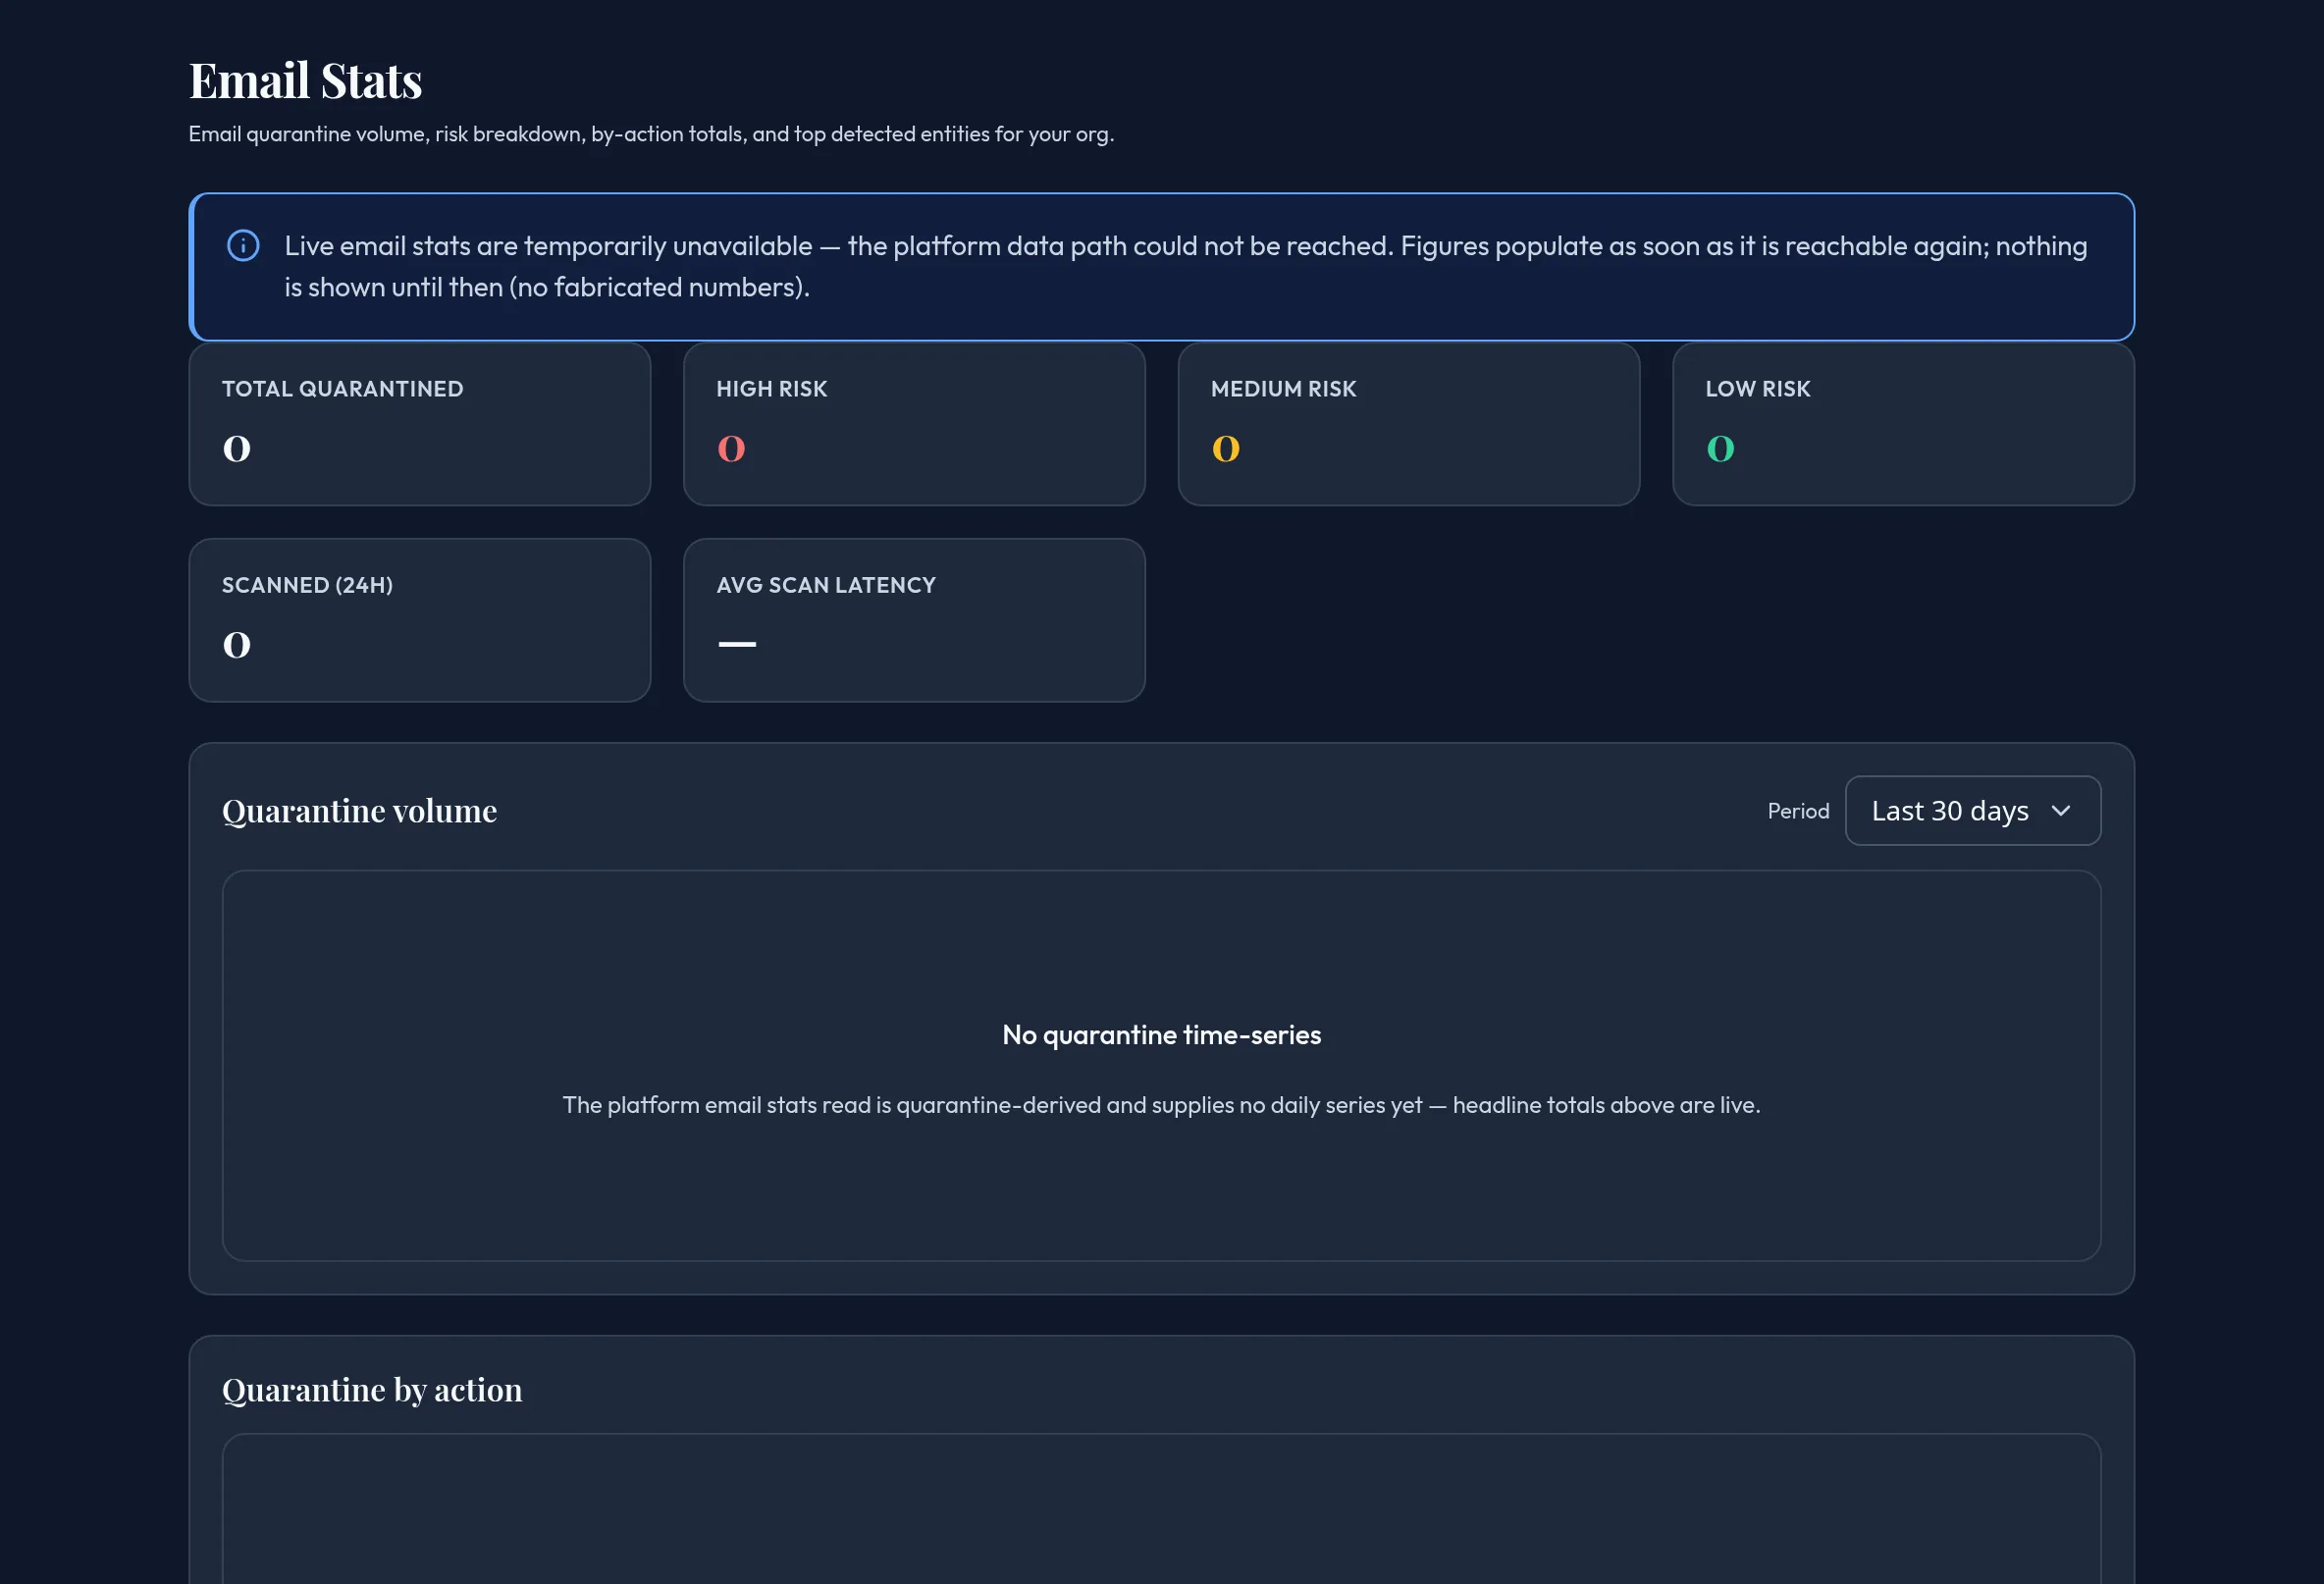
-
Open Monitoring & Reporting → Email Stats. Review the roll-up tiles: Total quarantined, the risk-tier counts, Scanned (24h), and Avg scan latency.
-
Pick a Period (7 / 30 / 90 days) to window the Quarantine volume trend chart.
-
Review Quarantine by action (block / redact / log-only) and Top detected entities, each with its percent of the total.
-
If the platform email-stats read is unreachable, the page shows an explicit info banner — “temporarily unavailable… no fabricated numbers” — while keeping the full layout visible.
API equivalent
Section titled “API equivalent”curl -X POST "https://admin.arbitex.ai/api/v1/admin/monitoring/email/stats" \ -H "Authorization: Bearer $ADMIN_TOKEN" \ -H "Content-Type: application/json" \ -d '{}'Plan & availability
Section titled “Plan & availability”Available on every plan. You need the Email Relay channel module configured to have quarantine data to show here.
Deployment notes
Section titled “Deployment notes”Total quarantined and trailing-24h scan volume are read live from the platform’s quarantine-derived data; the risk-tier split, daily trend, and top-entities breakdown are computed locally. If either path is unreachable, the affected figures degrade honestly rather than showing stale numbers.